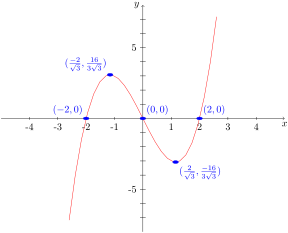
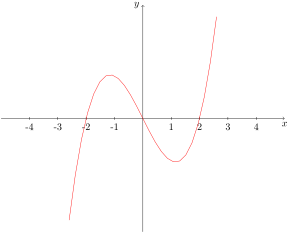
Graphs are an important visual aid in mathematics and it is important to learn how to draw them properly. For a graph to be useful it must display the important and interesting information about a function and have all relevant points clearly labeled.
You can often determine how much detail to include in your graph from the question. For example, if you are finding the extreme points of a function, then you will probably be expected to label these points on your graph. If you are only sketching the graph of a function, then less detail is required. The main purpose of a sketch is to get some idea of the general shape and behavior of the function. In this case, it is not usually necessary to label extreme points and intercepts. However, you should always remember to label your axes and put a title or caption on your graph, even if it is only a sketch. Use a ruler if necessary to draw straight lines. If you are drawing more than one curve on the same set of axes, take particular care to make sure that each curve is clearly labeled.
Choose a suitable scale so that all of the interesting features of the graph are included. For example, when graphing our function
\begin{equation*}
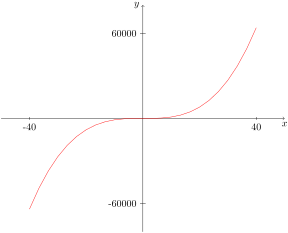
y= x^{3} - 4x
\end{equation*}
a suitable scale meant including all of the extreme points and \(x\)- and \(y\)-intercepts. Be especially careful about the scale when using a graphing calculator or computer. They do not have any idea which points are interesting, so they will often give inappropriate scales. The following graphs give examples of bad choices of scale for our problem.
Also make sure that what you are graphing makes sense. If you are drawing the graph of a function that represents the distance of a rocket from the surface of the earth against time, it makes no sense to include negative distances, as this is unphysical. Similar reasoning applies to graphs representing populations, areas, and volumes.
Finally, being able to draw and sketch graphs well can sometimes help while trying to answer a question, even if a graph is not required in the solution. For more difficult problems in particular, being able to sketch a function to identify its behavior often provides more insight than looking at the equation alone.